
DSP Telemetry, Logging & Traces#
Sound Open Firmware (SOF) uses the Zephyr RTOS logging subsystem as its firmware logging infrastructure. Because audio signal processing operates on strict sub-millisecond scheduling deadlines (e.g. 1 ms or 200 µs periods), DSP firmware cannot block on slow UART serial writes or synchronous host communications. Instead, SOF firmware emits log entries through Zephyr’s logging API, and the active Zephyr logging backend determines how those entries are transported to the host. Different hardware platforms use different backends: on Intel ADSPs, the mtrace-reader.py tool reads logs from the hardware mtrace buffer; on other platforms, different host-side utilities or transport mechanisms apply.
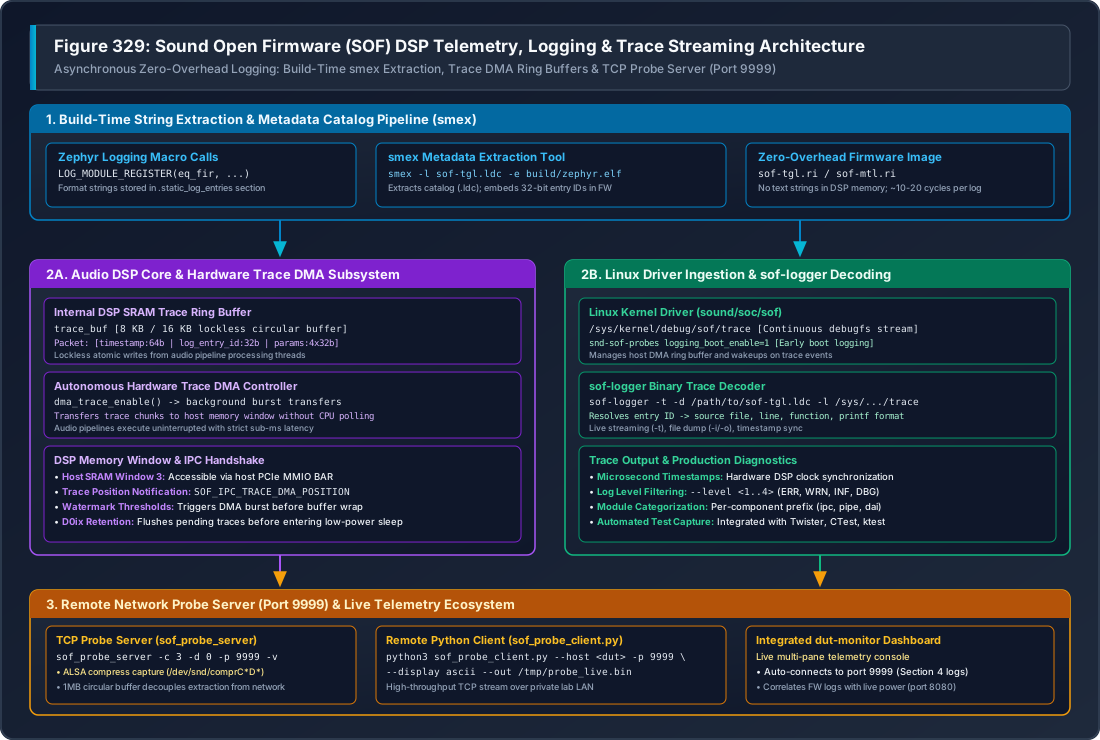
Figure 334 Figure 329: Sound Open Firmware (SOF) DSP Telemetry, Logging & Trace Streaming Architecture#
—
Architecture Overview#
The SOF logging infrastructure is split into three decoupled operational stages:
Build-Time Log Dictionary (Optional): SOF uses the Zephyr logging dictionary (
log_dictionary.json) produced during the firmware build. The dictionary maps compact binary log entry IDs back to their source strings, enabling offline decoding of captured log data. Generating the dictionary is optional; it is not required for basic log streaming withmtrace-reader.py.Runtime Execution & Autonomous DMA: The DSP core writes fixed-size binary trace packets into an internal SRAM circular ring buffer. A dedicated background hardware DMA channel transfers trace chunks to a shared host memory window without stalling audio pipeline processing loops.
Host-Side Ingestion & Real-Time Decoding: A Zephyr logging backend transports log entries from the DSP to the host. The backend is hardware-specific: on Intel ADSPs the
mtrace-reader.pyutility reads from the hardwaremtracebuffer; other platforms rely on their own transport mechanisms.
—
Zephyr Structured Logging Integration#
Modern SOF firmware natively integrates with the Zephyr RTOS logging subsystem (zephyr/logging/log.h). Each firmware module registers its logging domain and default verbosity level:
#include <zephyr/logging/log.h>
#include <sof/audio/component_ext.h>

/* Register module with Kconfig-defined default log level */
LOG_MODULE_REGISTER(eq_fir, CONFIG_SOF_LOG_LEVEL);

int eq_fir_process(struct comp_dev *dev)
{
    LOG_DBG("eq_fir_process: dev %p, frame count %u", dev, dev->frames);

    if (dev->state != COMP_STATE_ACTIVE) {
        LOG_WRN("eq_fir: processing called while state=%u not active", dev->state);
        return -EINVAL;
    }

    /* Processing inner loop executes without logging overhead */
    return 0;
}
Standard Logging Levels#
SOF utilizes four standard log levels mapped directly to Zephyr severity ratings:
Logging Macro |
Numeric Level |
Recommended Production & Debug Usage |
|---|---|---|
|
Level 1 |
Critical runtime failures, unrecoverable hardware errors, invalid IPC state transitions, memory allocations faults. Always enabled in production. |
|
Level 2 |
Recoverable boundary conditions, parameter sanitization clamps, non-fatal buffer underrun/overrun warnings. |
|
Level 3 |
Milestone events: component instantiation, pipeline binding, audio stream start/stop, clock frequency changes, power state transitions (D0 $leftrightarrow$ D0ix). |
|
Level 4 |
Verbose per-buffer execution traces, coefficient updates, DMA pointer offsets. Disabled in release builds to save CPU cycles and DMA bandwidth. |
—
Runtime DSP Trace DMA Engine#
At runtime, logging operations must never interrupt audio pipelines executing on strict DMA-driven period boundaries:
+-------------------------------------------------------------------------+
|                      DSP Internal SRAM (trace_buf)                      |
|                                                                         |
|  [ Audio Thread ] ---> Lockless Atomic Write -> [ Packet 0 | Packet 1 ] |
+-------------------------------------------------------------------------+
                                     |
                       Autonomous Trace DMA Transfer
                                     v
+-------------------------------------------------------------------------+
|                  Host Shared Memory (SRAM Window 3)                     |
|                                                                         |
|  [ DMA Position IPC ] -> Host Driver Interrupt -> [ Linux debugfs trace]|
+-------------------------------------------------------------------------+
Host-Side Ingestion & Decoding#
Linux Kernel debugfs Trace Node (IPC3)#
On Linux hosts with the mainline SOF driver loaded, the raw binary trace buffer is exposed via debugfs:
/sys/kernel/debug/sof/trace
Reading this file yields the continuous binary stream emitted by the DSP Trace DMA engine.
Early Boot Logging (snd-sof-probes)#
To capture early firmware initialization messages prior to userspace audio server startup, the snd-sof-probes client driver provides the logging_boot_enable parameter:
# Reload probe driver with boot logging enabled
sudo rmmod snd_sof_probes 2>/dev/null
sudo modprobe snd_sof_probes logging_boot_enable=1

# Verify boot logging initialization in kernel dmesg
dmesg | grep "logging_boot"
When enabled, the driver automatically allocates extraction DMA channels during probe registration and drains pre-buffered firmware initialization logs (up to 4 KB) before ALSA audio streams open.
—
Intel ADSP: Using mtrace-reader.py#
On Intel ADSP hardware, the Zephyr logging backend forwards log entries through the
hardware mtrace buffer. The mtrace-reader.py script reads from that buffer on the
host and prints decoded messages to standard output. On non-Intel platforms, consult the
platform-specific documentation for the applicable logging backend and host-side tooling.
mtrace-reader.py is available in the SOF main repository at
tools/mtrace/mtrace-reader.py.
Enabling mtrace in the Linux SOF Driver#
Before mtrace-reader.py can receive logs, the Linux SOF driver must be instructed to
program the firmware to emit logs via the mtrace backend. The sof_debug snd_sof kernel module parameter is a bitmask; setting
SOF_DBG_ENABLE_TRACE (0x1) instructs the driver to program the firmware to enable
log output through the mtrace buffer.
sudo modprobe snd_sof sof_debug=1
Acquiring mtrace-reader.py#
The recommended way to obtain the script is from the SOF main repository:
# Clone the SOF repository and locate the script
git clone https://github.com/thesofproject/sof.git
ls sof/tools/mtrace/mtrace-reader.py

# Or download the script directly
wget https://raw.githubusercontent.com/thesofproject/sof/main/tools/mtrace/mtrace-reader.py
Live Continuous Streaming#
Run mtrace-reader.py on the target system to stream firmware log output continuously:
# Stream live firmware traces from the mtrace buffer
python3 mtrace-reader.py
Saving Trace Output to a File#
Redirect standard output to capture a trace log for offline analysis:
# Capture trace output to a file
python3 mtrace-reader.py > /tmp/fw_mtrace.log
Running on a Remote DUT#
On remote hardware test stations accessed over SSH, launch mtrace-reader.py in the
background before starting the audio test:
# Copy script to DUT (if not already present)
scp sof/tools/mtrace/mtrace-reader.py root@<dut>:/tmp/

# Start mtrace reader on DUT prior to test execution
timeout 15 ssh -o ConnectTimeout=5 root@<dut> \
    'nohup python3 /tmp/mtrace-reader.py > /tmp/fw_mtrace.log 2>&1 &'

# Execute test audio pipeline
timeout 30 ssh -o ConnectTimeout=5 root@<dut> \
    'aplay -D hw:0 -r 48000 -c 2 -f S16_LE /dev/zero -d 5'

# Retrieve formatted trace log from DUT
scp root@<dut>:/tmp/fw_mtrace.log ./fw_mtrace.log

# Terminate reader
timeout 15 ssh -o ConnectTimeout=5 root@<dut> 'pkill -f mtrace-reader'
—
Legacy: Using sof-logger (non-Zephyr SOF firmware only)#
Note
sof-logger is only applicable to older SOF firmware versions that do not use the
Zephyr RTOS. On Intel ADSPs, Meteor Lake and all newer platforms are exclusively
supported by Zephyr-based SOF firmware; sof-logger cannot be used on those
platforms. For current platforms, use mtrace-reader.py as documented above.
The sof-logger host utility reads the binary trace stream from debugfs, resolves
metadata entry IDs using the .ldc catalog, and prints formatted messages with
microsecond-accurate timestamps:
Live Continuous Streaming#
# Stream and decode live traces directly from debugfs
sof-logger -t -l /lib/firmware/intel/sof-ipc4/tgl/community/sof-tgl.ldc
Offline Binary Trace Decoding#
If a binary trace dump was captured during an automated test run or hardware crash:
# Dump raw trace buffer to file
cat /sys/kernel/debug/sof/trace > /tmp/fw_trace.bin

# Decode offline trace file
sof-logger -d /path/to/sof-tgl.ldc -i /tmp/fw_trace.bin -o /tmp/decoded_trace.txt
Command-Line Options#
Flag |
Description & Usage |
|---|---|
|
Enable continuous real-time streaming mode (follows stream until interrupted). |
|
Specify the Log Dictionary Catalog file matching the target firmware build. |
|
Read binary trace data from a saved file instead of the default debugfs node. |
|
Write human-readable decoded trace output to the specified file. |
|
Strip ANSI color formatting codes for clean file logging. |
|
Filter messages below the specified severity level (1=ERR, 2=WRN, 3=INF, 4=DBG). |
—
Network Probe Server Streaming (Port 9999)#
On remote development and automated validation setups (DUTs), reading traces over SSH introduces significant network latency and terminal process overhead. SOF provides a high-throughput C streaming daemon—``sof_probe_server``—listening on TCP port 9999:
+--------------------------+                 +--------------------------+
|        Target DUT        |                 | Host Analysis Workstation|
|                          |                 |                          |
| [ DSP Trace DMA ]        |                 |                          |
|         |                |                 |                          |
|         v                |                 |                          |
| [/dev/snd/comprC3D0]     |                 |                          |
|         |                |                 |                          |
|         v                |                 |                          |
| [sof_probe_server :9999] | --- TCP/LAN --> | [sof_probe_client.py]    |
|   (1MB Ring Buffer)      |   (Port 9999)   |          or              |
|                          |                 | [dut-monitor Dashboard] |
+--------------------------+                 +--------------------------+
Running the Probe Server on Target DUT#
# Launch probe server on target board in background
timeout 15 ssh -o ConnectTimeout=5 root@<dut> \
    'nohup /usr/local/bin/sof_probe_server -c 3 -d 0 -p 9999 -v > /tmp/probe_server.log 2>&1 &'
Streaming via Host Python Client#
On the host workstation, stream and preview logs over the network:
# Connect to DUT probe server and stream live ASCII log output
python3 tools/sof-probe-server/sof_probe_client.py \
    --host <dut-ip> --port 9999 --display ascii --out /tmp/dut_trace.bin
Integrated dut-monitor Dashboard#
The dut-monitor terminal dashboard automatically connects to sof_probe_server on TCP port 9999 and renders live decoded DSP logs in Section 4, alongside synchronized power telemetry (port 8080) and CPU metrics.
—
Troubleshooting & Diagnostics#
Trace Buffer Wraparound & Missing Entries#
Symptom: Non-sequential timestamps or apparent gaps in the decoded log output.
Root Cause: Host reader cannot consume trace DMA packets quickly enough during bursts of
LOG_DBGcalls, overflowing the internal SRAM buffer.Resolution: 1. Filter out high-frequency debug logs by raising
CONFIG_SOF_LOG_LEVELtoCONFIG_LOG_DEFAULT_LEVEL=3(INFO). 2. Increase internal trace buffer size in Kconfig:CONFIG_SOF_TRACE_BUF_SIZE=16384. 3. Stream viasof_probe_serverusing its 1 MB host-side circular queue rather than reading directly through debugfs over SSH.
No Output from mtrace-reader.py#
Symptom:
mtrace-reader.pyproduces no output or exits immediately.Root Cause: The
mtracebuffer is not active, or the DSP core is suspended in D0ix sleep.Resolution: 1. Start an audio playback stream to bring the DSP into active D0 state:
aplay -D hw:0 -r 48000 -c 2 -f S16_LE /dev/zero &. 2. Verify logging is enabled in kernel module:modprobe snd-sof sof_debug=1.
Zero Data from debugfs Node#
Symptom:
cat /sys/kernel/debug/sof/tracereturns 0 bytes.Root Cause: Trace DMA is not enabled or the DSP core is suspended in D0ix sleep.
Resolution: 1. Start an audio playback stream to bring the DSP into active D0 state:
aplay -D hw:0 -r 48000 -c 2 -f S16_LE /dev/zero &. 2. Verify kernel probe module:modprobe snd-sof-probes logging_boot_enable=1.