Debug Component in Testbench
GDB and DDD
Code debugging with debugger is an efficient way to find issues in components. The code may crash or operate incorrectly. The SOF data structures can be understood better while seeing them in action.
In a testbench environment, a severe memory access mistake typically results in a segmentation fault where the operating system traps the application when it performs illegal memory access to RAM it has not allocated. The debugger shows the stack trace of calls if this happens for quick spotting of offending code.
A stable but incorrectly working component can be examined with breakpoints and visualization of data structures.
To initiate debugging, the output from our previous IIR EQ example is used (refer to Build and Run Testbench). The information for debugging is shown below:
./eqiir_run.sh 16 16 48000 audio_in.raw audio_out.raw
Command:         ../../testbench/build_testbench/install/bin/testbench
Argument:        -d -r 48000 -R 48000 -i audio_in.raw -o audio_out.raw -t ../../build_tools/test/topology/test-playback-ssp5-mclk-0-I2S-eq-iir-s16le-s16le-48k-24576k-codec.tplg -b S16_LE
LD_LIBRARY_PATH: ../../testbench/build_testbench/sof_ep/install/lib:../../testbench/build_testbench/sof_parser/install/lib
In the above output the command shows the path to the installed testbench
binary. The arguments specify the input and output sample rate, input
and output RAW data files, the topology to use for testing, and the sample
format. The command line options are described when invoking the binary with
switch -h. But for the binary to work correctly, the dynamic libraries path must be instructed for the operating system. This is done by setting the
environment variable LD_LIBRARY_PATH to the above shown value.
export LD_LIBRARY_PATH=../../testbench/build_testbench/sof_ep/install/lib:../../testbench/build_testbench/sof_parser/install/lib
../../testbench/build_testbench/install/bin/testbench -h
If the help text appears, the testbench binary started directly from the command line works. Next, the testbench can be started in the Data Display Debugger (DDD) application. DDD is a graphical front-end for the GNU Debugger (GDB). DDD and the dependencies such as GDB needs to be installed if it is missing from the development computer.
sudo apt install ddd
The debugging is started to the previously used shell with the
LD_LIBRARY_PATH set.
ddd ../../testbench/build_testbench/install/bin/testbench
This opens the debugger window. From there, find the code line just after
topology parsing (currently 295) by scrolling the code window with a mouse
and placing a break point there with the right-mouse button (a red stop
sign). If issues happen at topology parsing or within the component in
instantiating in new(), place the breakpoint to the parse_topology()
line.
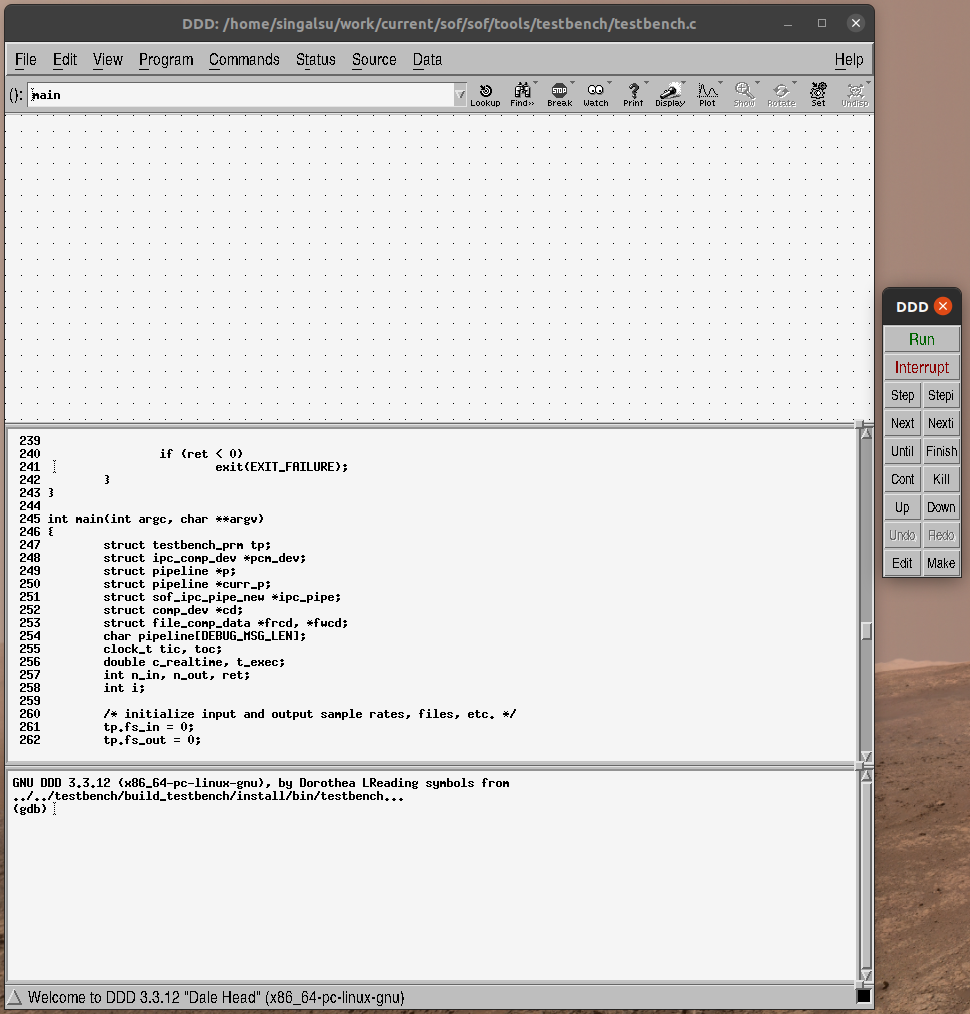
Figure 142 The ddd debugger start view.
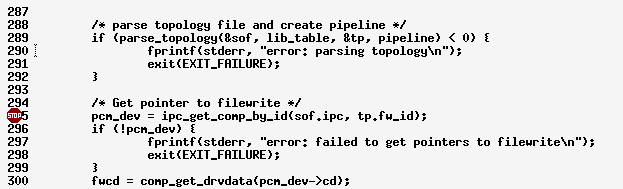
Figure 143 Breakpoint added with right-mouse click.
The breakpoint is placed after topology parsing since the component symbols do not exist in debugger context before it is loaded by the topology. To run the testbench until breakpoint, select Program -> Run from the menu as shown in the image above. Then use your mouse to copy and paste the argument line output from the previous script run and click Run:
-d -r 48000 -R 48000 -i audio_in.raw -o audio_out.raw -t ../../build_tools/test/topology/test-playback-ssp5-mclk-0-I2S-eq-iir-s16le-s16le-48k-24576k-codec.tplg -b S16_L
The execution is now stopped to breakpoint. Since the symbols exist now, the
breakpoints can be added to the component life cycle after new(). Use
the lowest window part with the prompt (gdb) for convenience.
break eq_iir_cmd
break eq_iir_params
break eq_iir_prepare
break eq_iir_copy
break eq_iir_reset
break eq_iir_free
Next, press Cont in the small remote control window next to the main ddd
window. The execution stops at the params() function in playback start.
To view stream parameters, mouse left-click on params in the function
arguments list and use the mouse to right-click “Display *params”. The same
can be done for the dev structure. The suppressed fields in brackets can be
expanded and pointers such as the field pipeline from dev can be viewed
by right-mouse clicking “Display *()” from a viewed pointer field. The
boxes can be arranged with the mouse.
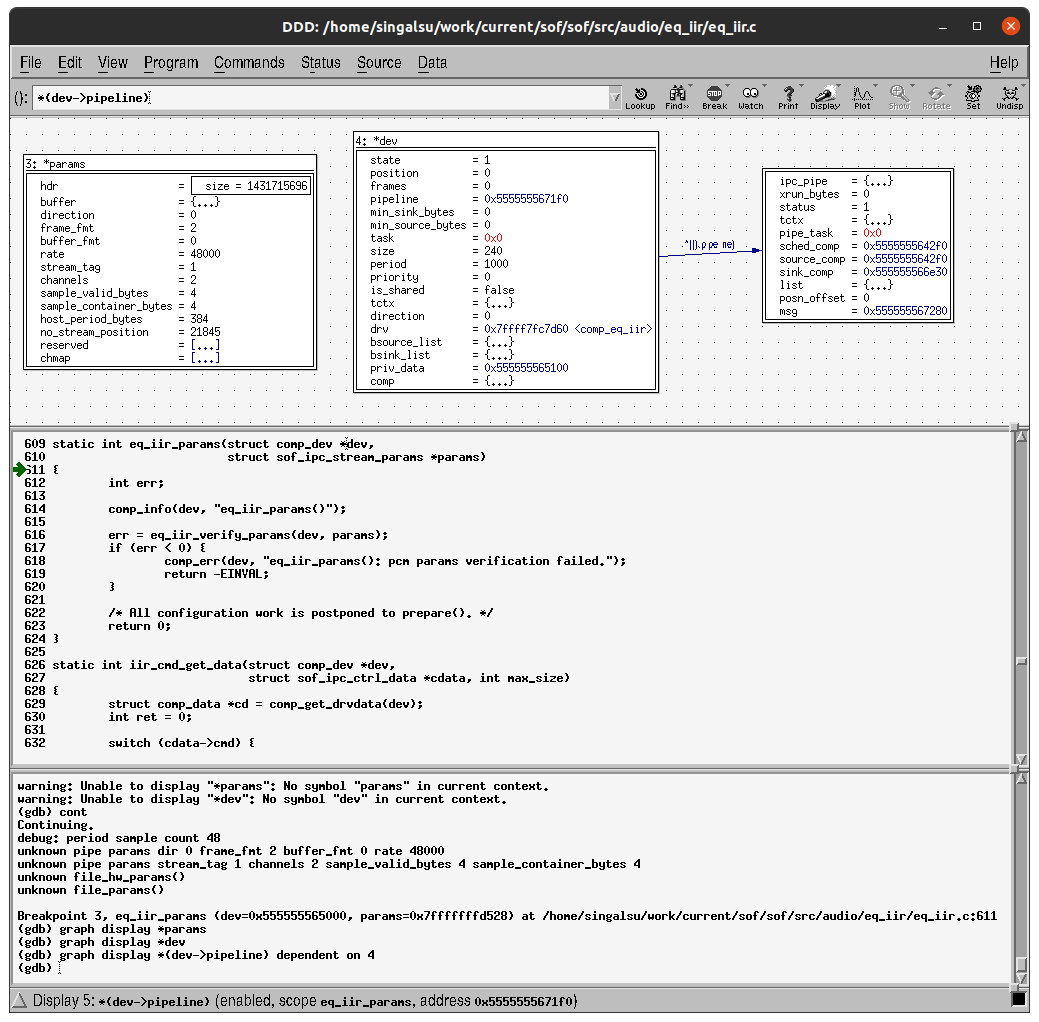
Figure 144 Viewing data in ddd.
By further pressing Cont, the code can be run into prepare(). The
next Cont press brings the execution to copy(). A breakpoint can be
added to a known processing function:
break eq_iir_s32_default
In the function, step with Next over code lines until the read frag operation for the source buffer is completed. The input frame of two channels to be consumed and produced can be added to view with the following command:
graph display x[0]@2
graph display y[0]@2
You can also display the entire sink buffer content to see the circular update over two periods of data. The format can be changed to hex if desired with a right-mouse click of the data.
graph display ((int16_t *)sinkb->stream.addr)[0]@192
Note
DDD has data plotting capability but the feature does not work at the
time of this writing. Such a feature can be useful in finding PCM code
data glitches. For a simpler one-time view, .gdbinit can be set up
with a macro script to plot the buffers with gnuplot. Examples can be
found via web search.
Note
Due to code optimization with the -O flag, some symbols are optimized
out and do not exist in context. Also, the code lines stepping may appear
to be non-linear. The testbench can be built as a debug version with the
cmake build type definition.
cd tools/testbench/build_testbench
cmake -DCMAKE_BUILD_TYPE=Debug ..
make install
At the time of this writing, the flag does not propagate properly
into generated Makefiles. It may be necessary to manually edit
flags.make to remove the -O3 flags. They can be found by running:
grep -r "O3"
Valgrind
Valgrind is a C library run-time that does extensive checks for memory access. It finds and reports issues that normally do not segfault the testbench. Components with violations would keep running in the firmware but would cause random instability and failures.
Using Valgrind is simple. The previously used command line for testbench run is passed as an argument to the valgrind command:
valgrind ../../testbench/build_testbench/install/bin/testbench -d -r 48000 -R 48000 -i audio_in.raw -o audio_out.raw -t ../../build_tools/test/topology/test-playback-ssp5-mclk-0-I2S-eq-iir-s16le-s16le-48k-24576k-codec.tplg -b S16_L
Note
Valgrind finds issues from the current testbench version. The issues
before component new() and after component free() are usually due
to shortcuts taken in porting part of SOF to the testbench or from
non-critical features like printing traces. Issues like these that are
found during the component life cycle should be checked and fixed.
Gprof
The hotspots of the components can be found with a profiling tool. The functions that are called most frequently or where the majority of CPU time is spent are the best candidates to optimize for speed.
The GNU C compiler (GCC) supports option -pg to enable the generation of
profiling data when running the executable. There is no cmake build option
for enabling profiling but the cmake files can be hand-edited to contain
-pg instead of -g.
A run of profiling enabled code generates the data file that is viewed with
the gprof command.
../../testbench/build_testbench/install/bin/testbench -d -r 48000 -R 48000 -i audio_in.raw -o audio_out.raw -t ../../build_tools/test/topology/test-playback-ssp5-mclk-0-I2S-eq-iir-s16le-s16le-48k-24576k-codec.tplg -b S16_L
gprof ../../testbench/build_testbench/install/bin/testbench gmon.out