Test Audio Quality
The tools/test/audio directory contains support for testing objective
audio quality parameters. The tests include gain, frequency response (FR),
dynamic range (DR), and total harmonic distortion plus noise (THD+N).
Definitions can be found in the Audio Engineering Society’s AES17 standard.
Install Octave or Matlab to execute the tests. Matlab is a commercial product by MathWorks. GNU Octave is a free software tool that is mostly compatible with Matlab. Install Octave and useful toolboxes for audio development by entering the following:
sudo apt install octave octave-signal octave-control octave-io
Start Octave from the correct directory for tests by entering the following:
cd tools/test/audio
octave --gui &
From the Octave shell, the test script for the IIR EQ component can be launched for all support sample formats:
help process_test
process_test('eqiir')
The test outputs a CSV format table with test results such as the following:
eqiir test result: Gain (dB)
in \ out,       16,       24,       32
      16,    -7.33,        x,        x
      24,        x,    -7.33,        x
      32,        x,        x,    -7.33


eqiir test result: Dynamic range (dB CCIR-RMS)
in \ out,       16,       24,       32
      16,    82.43,        x,        x
      24,        x,   130.40,        x
      32,        x,        x,   149.12


eqiir test result: Worst-case THD+N vs. frequency
in \ out,       16,       24,       32
      16,   -54.93,        x,        x
      24,        x,   -98.01,        x
      32,        x,        x,   -99.55


eqiir test result: Fails chirp/gain/DR/THD+N/FR
in \ out,             16,             24,             32
      16,      0/0/0/0/0,              x,              x
      24,              x,      0/0/0/0/0,              x
      32,              x,              x,      0/0/0/0/0


Number of passed tests = 15
Number of failed tests = 0
Number of non-applicable tests = 0
Number of skipped tests = 0
The script is currently set up for batch processing in the text console. To enable graphics plot windows, edit the script to the following:
diff --git a/tools/test/audio/process_test.m b/tools/test/audio/process_test.m
index 1a802b462..6ec6cda2b 100644
--- a/tools/test/audio/process_test.m
+++ b/tools/test/audio/process_test.m
@@ -48,8 +48,8 @@ t.full_test = 1;                       % 0 is quick check only, 1 is full set
 %  visibility set to to 0 only console text is seen. The plots are
 %  exported into plots directory in png format and can be viewed from
 %  there.
-t.plot_close_windows = 1;  % Workaround for visible windows if Octave hangs
-t.plot_visible = 'off';    % Use off for batch tests and on for interactive
+t.plot_close_windows = 0;  % Workaround for visible windows if Octave hangs
+t.plot_visible = 'on';     % Use off for batch tests and on for interactive
 t.files_delete = 1;        % Set to 0 to inspect the audio data files

 %% Prepare
When the example test for 24 bit to 24 bit output is executed with process_test(‘eqiir’, 24, 24), the following plots are generated. They are useful to visually gain more insight into the component’s characteristics.
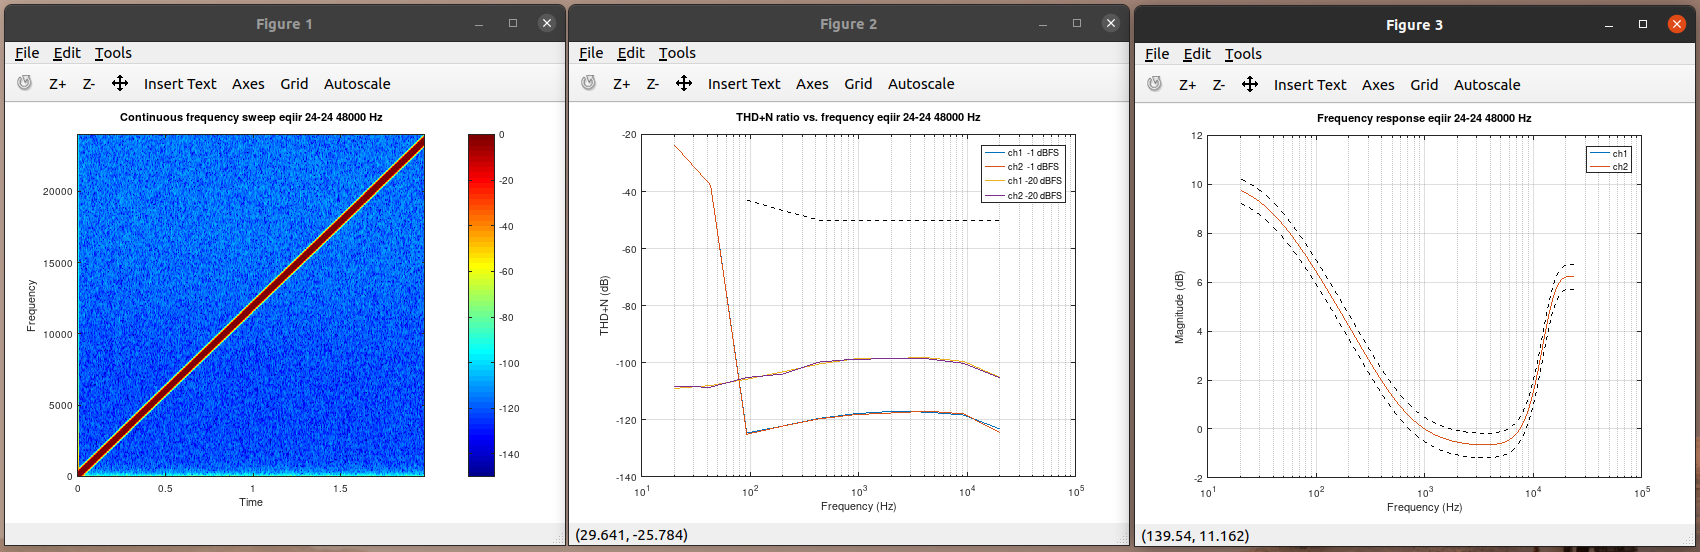
Figure 145 Test results for EQ IIR component: Chirp spectrogram, THD+N frequency sweep, measured FR.
For new components development when the test set is suitable, such as the
previous example “newcomp”, this script requires a small addition. A need exists to create a newcomp_run.sh script based on existing examples
found in the same directory. Additional customization can also be done such as re-defining the test pass/fail criteria for EQ components.
diff --git a/tools/test/audio/process_test.m b/tools/test/audio/process_test.m
index fd9055cae..1a802b462 100644
--- a/tools/test/audio/process_test.m
+++ b/tools/test/audio/process_test.m
@@ -373,7 +373,7 @@ end
 function test = test_run_process(test, t)

 switch lower(test.comp)
-       case {'eqiir', 'eqfir', 'dcblock', 'volume', 'tdfb'}
+       case {'eqiir', 'eqfir', 'dcblock', 'volume', 'tdfb', 'newcomp'}
               test.ex = sprintf('./%s_run.sh', lower(test.comp));
        otherwise
                error('Unknown component');